Load Data and Libraries
# Load Libraries
library(tidyverse)
library(tidyexposomics)
We will start off with our example dataset pulled from the ISGlobal Exposome Data Challenge 2021 (Maitre et al., 2022).
# Load example data
data("tidyexposomics_example")

# Create exposomic set object
expom <- create_exposomicset(
    codebook = tidyexposomics_example$annotated_cb,
    exposure = tidyexposomics_example$meta,
    omics = list(
        "Gene Expression" = tidyexposomics_example$exp_filt,
        "Methylation" = tidyexposomics_example$methyl_filt
    ),
    row_data = list(
        "Gene Expression" = tidyexposomics_example$exp_fdata,
        "Methylation" = tidyexposomics_example$methyl_fdata
    )
)
## Ensuring all omics datasets are matrices with column names.## Creating SummarizedExperiment objects.## Creating MultiAssayExperiment object.## MultiAssayExperiment created successfully.We will focus on a few exposure variable categories.
# Grab exposure variables
exp_vars <- tidyexposomics_example$annotated_cb |>
    filter(category %in% c(
        "aerosol",
        "main group molecular entity",
        "polyatomic entity"
    )) |>
    pull(variable) |>
    as.character()
Quality Control
As in the main vignette, we will impute exposure data using
missforest.
# Impute missing values
expom <- run_impute_missing(
    exposomicset = expom,
    exposure_impute_method = "missforest",
    exposure_cols = exp_vars
)
## Imputing exposure data using method: missforestAnd we will transform our exposure data to ensure it is more normally
distributed using the boxcox_best method.
# Transform variables
expom <- transform_exposure(
    exposomicset = expom,
    transform_method = "boxcox_best",
    exposure_cols = exp_vars
)
## Applying the boxcox_best transformation.Exposome Scores
We can calculate exposome scores, which are a summary measure of
exposure. The run_exposome_score function is used to
calculate the exposome score. The exposure_cols argument is
used to set the columns to use for the exposome score. The
score_type argument is used to set the type of score to
calculate. Here we could use:
median: Calculates the median of the exposure variables.mean: Calculates the mean of the exposure variables.sum: Calculates the sum of the exposure variables.pca: Calculates the first principal component of the exposure variables.irt: Uses Item Response Theory to calculate the exposome score.quantile: Calculates the quantile of the exposure variables.var: Calculates the variance of the exposure variables.
The score_column_name argument is used to set the name
of the column to store the exposome score in. Here we will define a
score for aerosols using a variety of different methods and demonstrate
their use in association with asthma status.
# determine which aerosol variables to use
aerosols <- c("h_pm25_ratio_preg_None", "h_pm10_ratio_preg_None")

# Create exposome scores
expom <- expom |>
    run_exposome_score(
        exposure_cols = aerosols,
        score_type = "median",
        score_column_name = "exposome_median_score"
    ) |>
    run_exposome_score(
        exposure_cols = aerosols,
        score_type = "pca",
        score_column_name = "exposome_pca_score"
    ) |>
    run_exposome_score(
        exposure_cols = aerosols,
        score_type = "irt",
        score_column_name = "exposome_irt_score"
    ) |>
    run_exposome_score(
        exposure_cols = aerosols,
        score_type = "quantile",
        score_column_name = "exposome_quantile_score"
    ) |>
    run_exposome_score(
        exposure_cols = aerosols,
        score_type = "var",
        score_column_name = "exposome_var_score"
    )
## Extracting exposure data...
## Extracting exposure data...
## Extracting exposure data...
## Extracting exposure data...
## Extracting exposure data...## Calculating median exposure scores...## Calculating PCA exposure scores...## Calculating IRT exposure scores...## Warning: EM cycles terminated after 500 iterations.## Calculating quantile exposure scores...## Calculating variance exposure scores...We can then associate these exposome scores with asthma status using
the run_association function, just like we did before.
However, this time we specify our feature_set to be the
exposome scores we just calculated.
# Associate exposome scores with outcome
expom <- run_association(
    exposomicset = expom,
    outcome = "hs_asthma",
    source = "exposures",
    feature_set = c(
        "exposome_median_score",
        "exposome_pca_score",
        "exposome_irt_score",
        "exposome_quantile_score",
        "exposome_var_score"
    ),
    action = "add",
    family = "binomial"
)
## Running GLMs.
# Plot the association forest plot
plot_association(
    exposomicset = expom,
    source = "exposures",
    terms = c(
        "exposome_median_score",
        "exposome_pca_score",
        "exposome_irt_score",
        "exposome_quantile_score",
        "exposome_var_score"
    ),
    filter_col = "p.value",
    filter_thresh = 0.05,
    r2_col = "r2"
)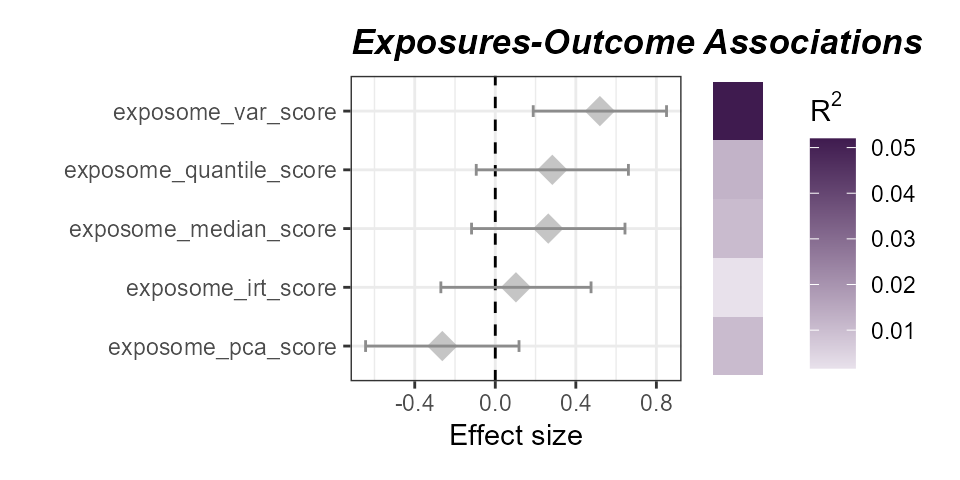
Associations of aerosol exposome scores with asthma status. The variance-based score has the strongest association with asthma status.
Session Info
See Session Info
sessionInfo()
## R version 4.5.1 (2025-06-13 ucrt)
## Platform: x86_64-w64-mingw32/x64
## Running under: Windows 11 x64 (build 26200)
##
## Matrix products: default
##   LAPACK version 3.12.1
##
## locale:
## [1] LC_COLLATE=English_United States.utf8
## [2] LC_CTYPE=English_United States.utf8
## [3] LC_MONETARY=English_United States.utf8
## [4] LC_NUMERIC=C
## [5] LC_TIME=English_United States.utf8
##
## time zone: America/New_York
## tzcode source: internal
##
## attached base packages:
## [1] stats4    stats     graphics  grDevices utils     datasets  methods
## [8] base
##
## other attached packages:
##  [1] tidyexposomics_0.99.16      MultiAssayExperiment_1.36.1
##  [3] SummarizedExperiment_1.40.0 Biobase_2.70.0
##  [5] GenomicRanges_1.62.1        Seqinfo_1.0.0
##  [7] IRanges_2.44.0              S4Vectors_0.48.0
##  [9] BiocGenerics_0.56.0         generics_0.1.4
## [11] MatrixGenerics_1.22.0       matrixStats_1.5.0
## [13] lubridate_1.9.5             forcats_1.0.1
## [15] stringr_1.6.0               dplyr_1.1.4
## [17] purrr_1.2.0                 readr_2.2.0
## [19] tidyr_1.3.2                 tibble_3.3.0
## [21] ggplot2_4.0.2               tidyverse_2.0.0
## [23] BiocStyle_2.38.0
##
## loaded via a namespace (and not attached):
##   [1] fs_2.1.0             naniar_1.1.0         httr_1.4.8
##   [4] RColorBrewer_1.1-3   tools_4.5.1          doRNG_1.8.6.3
##   [7] backports_1.5.0      R6_2.6.1             DT_0.34.0
##  [10] vegan_2.7-3          mgcv_1.9-3           permute_0.9-10
##  [13] withr_3.0.2          gridExtra_2.3        progressr_0.18.0
##  [16] cli_3.6.5            textshaping_1.0.4    factoextra_2.0.0
##  [19] RGCCA_3.0.3          labeling_0.4.3       sass_0.4.10
##  [22] S7_0.2.1             randomForest_4.7-1.2 proxy_0.4-29
##  [25] pbapply_1.7-4        pkgdown_2.2.0        systemfonts_1.3.2
##  [28] foreign_0.8-90       R.utils_2.13.0       parallelly_1.46.1
##  [31] sessioninfo_1.2.3    itertools_0.1-3      limma_3.66.0
##  [34] rstudioapi_0.18.0    RSQLite_2.4.6        car_3.1-5
##  [37] Matrix_1.7-4         clipr_0.8.0          abind_1.4-8
##  [40] R.methodsS3_1.8.2    lifecycle_1.0.5      yaml_2.3.12
##  [43] carData_3.0-6        recipes_1.3.1        SparseArray_1.10.8
##  [46] BiocFileCache_3.0.0  grid_4.5.1           blob_1.3.0
##  [49] promises_1.5.0       crayon_1.5.3         lattice_0.22-7
##  [52] pillar_1.11.1        knitr_1.51           corpcor_1.6.10
##  [55] future.apply_1.20.2  mixOmics_6.34.0      codetools_0.2-20
##  [58] glue_1.8.0           beepr_2.0            data.table_1.18.2.1
##  [61] vctrs_0.6.5          Rdpack_2.6.6         testthat_3.3.2
##  [64] gtable_0.3.6         assertthat_0.2.1     cachem_1.1.0
##  [67] gower_1.0.2          xfun_0.54            rbibutils_2.4.1
##  [70] S4Arrays_1.10.1      mime_0.13            prodlim_2025.04.28
##  [73] survival_3.8-3       timeDate_4052.112    audio_0.1-12
##  [76] iterators_1.0.14     hardhat_1.4.2        lava_1.8.2
##  [79] statmod_1.5.1        ipred_0.9-15         nlme_3.1-168
##  [82] fenr_1.8.1           bit64_4.6.0-1        filelock_1.0.3
##  [85] splines2_0.5.4       bslib_0.10.0         Deriv_4.2.0
##  [88] otel_0.2.0           rpart_4.1.24         colorspace_2.1-2
##  [91] DBI_1.3.0            Hmisc_5.2-5          nnet_7.3-20
##  [94] tidyselect_1.2.1     bit_4.6.0            compiler_4.5.1
##  [97] curl_7.0.0           httr2_1.2.2          htmlTable_2.4.3
## [100] desc_1.4.3           DelayedArray_0.36.0  bookdown_0.46
## [103] checkmate_2.3.4      scales_1.4.0         rappdirs_0.3.4
## [106] digest_0.6.39        rmarkdown_2.30       XVector_0.50.0
## [109] htmltools_0.5.9      pkgconfig_2.0.3      base64enc_0.1-6
## [112] SimDesign_2.24       dbplyr_2.5.2         fastmap_1.2.0
## [115] rlang_1.1.7          htmlwidgets_1.6.4    shiny_1.13.0
## [118] farver_2.1.2         jquerylib_0.1.4      jsonlite_2.0.0
## [121] BiocParallel_1.44.0  dcurver_0.9.3        ModelMetrics_1.2.2.2
## [124] R.oo_1.27.1          magrittr_2.0.4       Formula_1.2-5
## [127] patchwork_1.3.2      Rcpp_1.1.1           visdat_0.6.0
## [130] stringi_1.8.7        pROC_1.19.0.1        brio_1.1.5
## [133] MASS_7.3-65          plyr_1.8.9           parallel_4.5.1
## [136] listenv_0.10.1       ggrepel_0.9.7        splines_4.5.1
## [139] hms_1.1.4            igraph_2.2.2         ggpubr_0.6.3
## [142] ranger_0.18.0        ggsignif_0.6.4       rngtools_1.5.2
## [145] reshape2_1.4.5       GPArotation_2025.3-1 tidybulk_2.0.1
## [148] evaluate_1.0.5       BiocManager_1.30.27  tzdb_0.5.0
## [151] foreach_1.5.2        missForest_1.6.1     httpuv_1.6.16
## [154] future_1.70.0        mirt_1.46.1          BiocBaseUtils_1.12.0
## [157] broom_1.0.12         xtable_1.8-8         e1071_1.7-17
## [160] RSpectra_0.16-2      rstatix_0.7.3        later_1.4.8
## [163] class_7.3-23         ragg_1.5.0           rARPACK_0.11-0
## [166] memoise_2.0.1        ellipse_0.5.0        cluster_2.1.8.2
## [169] timechange_0.4.0     globals_0.19.1       caret_7.0-1